Preface
Logging is one of the critical components for developers. Every time when things went wrong, we had no doubt but checked what’s going on in logs. Fluentd is an open source data collector solution which provides many input/output plugins to help us organize our logging layer. There are tons of articles describing the benefits of using Fluentd such as buffering, retries and error handling. In this note I don’t plan to describe it again, instead, I will address more how to tweak the performance of Fluentd aggregator. Especially the case I use the most when fluentd talks to elasticsearch.
The typical way to utilize fluentd is like the following architecture. We can use sidecar fluentd container to collect application logs and transfer logs to fluentd aggregator. By adopting sidecar pattern, fluentd will take care of error handling to deal with network transient failures. Moreover, our application can write logs asynchronously to fluentd sidecar which prevents our application from being affected once remote logging system becomes unstable.

To understand more benefits, I suggest you guys take a look at this youtube video which gives a really great explanation.
Problem
Since many fluentd sidecars write their logs to fluentd aggregator, soon or later you will face some performance issues. For example, if our aggregator attempts to write logs to elasticsearch, but the write compacity of elasticsearch is insufficient. Then you will see a lot of 503 returns from elasticsearch and fluetnd aggregator has no other choices but keep records in the local buffer (in memory or files). The worst scenario is we run out of the buffer space and start dropping our records. There are 2 possible solutions comes to my mind to tackle this situation:
- Increase the size of elasticsearch, though it’s easy for me to change elasticsearch size (yes, I use AWS managed elasticsearch), this makes us spend more money on elasticserach nodes.
- Tweak the fluentd aggregator parameters to see if we can improve the bottleneck.
So before I increase elasticsearch node size, I tend to try option 2 to see how much performance can be improved by tuning the parameters.
Understand Buffer plugin
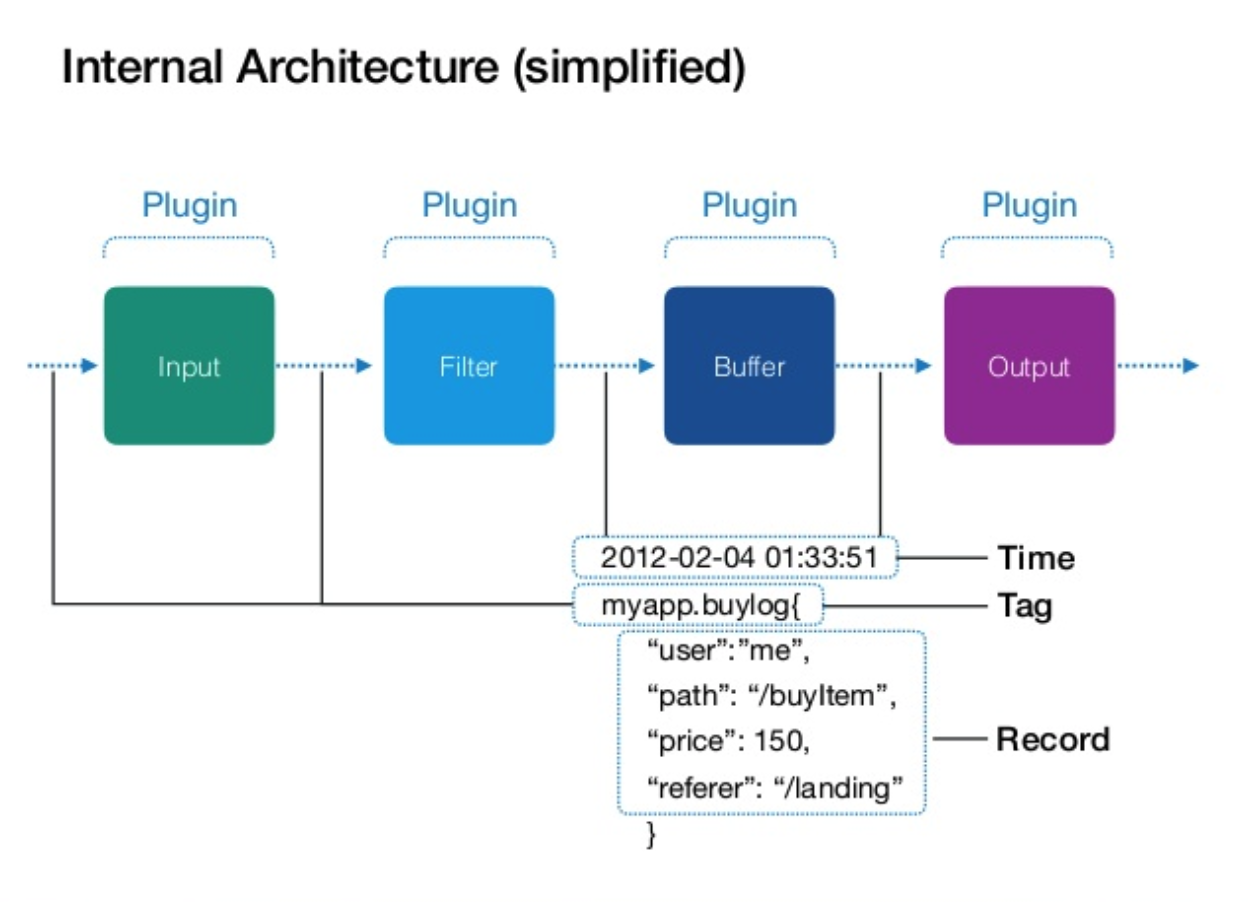
This picture borrowed from this official slides. Let’s see how fluentd work internally. Here we only focus on input & buffer
Input
When messages come in, it would be assigned a timestamp and a tag. Messages itself is wrapped as arecord which is structured JSON format. timestamp + tag + record is called event.
1 | Timestamp: 2019-05-04 01:22:12 |
Buffer

According to the document of fluentd, buffer is essentially a set of chunk. Chunk is filled by incoming events and is written into file or memory. Buffer actually has 2 stages to store chunks. These 2 stages are called stage and queue respectively. Typically buffer has an enqueue thread which pushes chunks to queue. Buffer also has a flush thread to write chunks to destination.
Stage
chunk is allocated and filled in the stage level. Here we can specify some parameters to change the behavior of allocation and flushing.
chunk_limit_sizedecides max size of each chunkschunk_limit_recordsthe max number of events that each chunks haveflush_intervaldefines how often it invokesenqueue, this only works whenflush_modebeing set tointerval
The enqueue thread will write chunk to queue based on the size and flush interval so that we can decide if we care more about latency or throughput (send more data or send data more frequent).
queue
queue stores chunks and flush thread dequeues chunk from queue.
flush_thread_count: we can launch more than 1flush thread, which can help us flush chunk in parallel.flush_thread_intervaldefine interval to invoke flush threadflush_thread_burst_intervalif buffer queue is nearly full, how often flush thread will be invoked.
Typically we will increase flush_thread_count to increase throughput and also deal with network transient failure. see https://github.com/uken/fluent-plugin-elasticsearch#suggested-to-increase-flush_thread_count-why
Other parameters
total_limit_sizetotal buffer size (chunk size + queue size)overflow_actionwhen buffer is full, what kind of action we need to take
Note
Buffer plugin is extremely useful when the output destination provides bulk or batch API. So that we are able to flush whole chunk content at once by using those APIs instead of sending request multiple times. It’s the secret why many fluetnd output plugins make use of buffer plugins. For understanding the further detail, I suggest you guys go through the source code.
Tweaking elasticsearch plugins
After we understand how important buffer plugins is, we can go back to see how to tweak our elsticsearch plugin. For our use case, I try to collect logs as much as possible with small elasticsearch node.
The initial setting is like
1 | <buffer> |
The problem is that chunk fluentd collects is too small which lead to invoke too many elasticsearch write APIs. This also makes fluend queues many chunks in the disk due to fail requests of elasticsearch.
From AWS ES doc we know that the http payload varies with different instance type. The maximum size of HTTP request payloads of most instance type is 100MB. Thus we should make our chunk limit size bigger but less than 100MB. Plus we should increase the flush_interval so that fluentd is able to create big enough chunk before flushing to queue. Here we also adjust flush_thread_count depending on elasticsearch plugin suggestion.
The modified version:
<buffer>
      @file
      path /fluentd/log/buffer

      total_limit_size 1024MB
      # chunk + enqueue
    chunk_limit_size 16MB
    flush_mode interval
    flush_interval 5s
    # flush thread
    flush_thread_count 8

    retry_type exponential_backoff
    retry_timeout 1h
    retry_max_interval 30
    overflow_action drop_oldest_chunk
</buffer>
Result
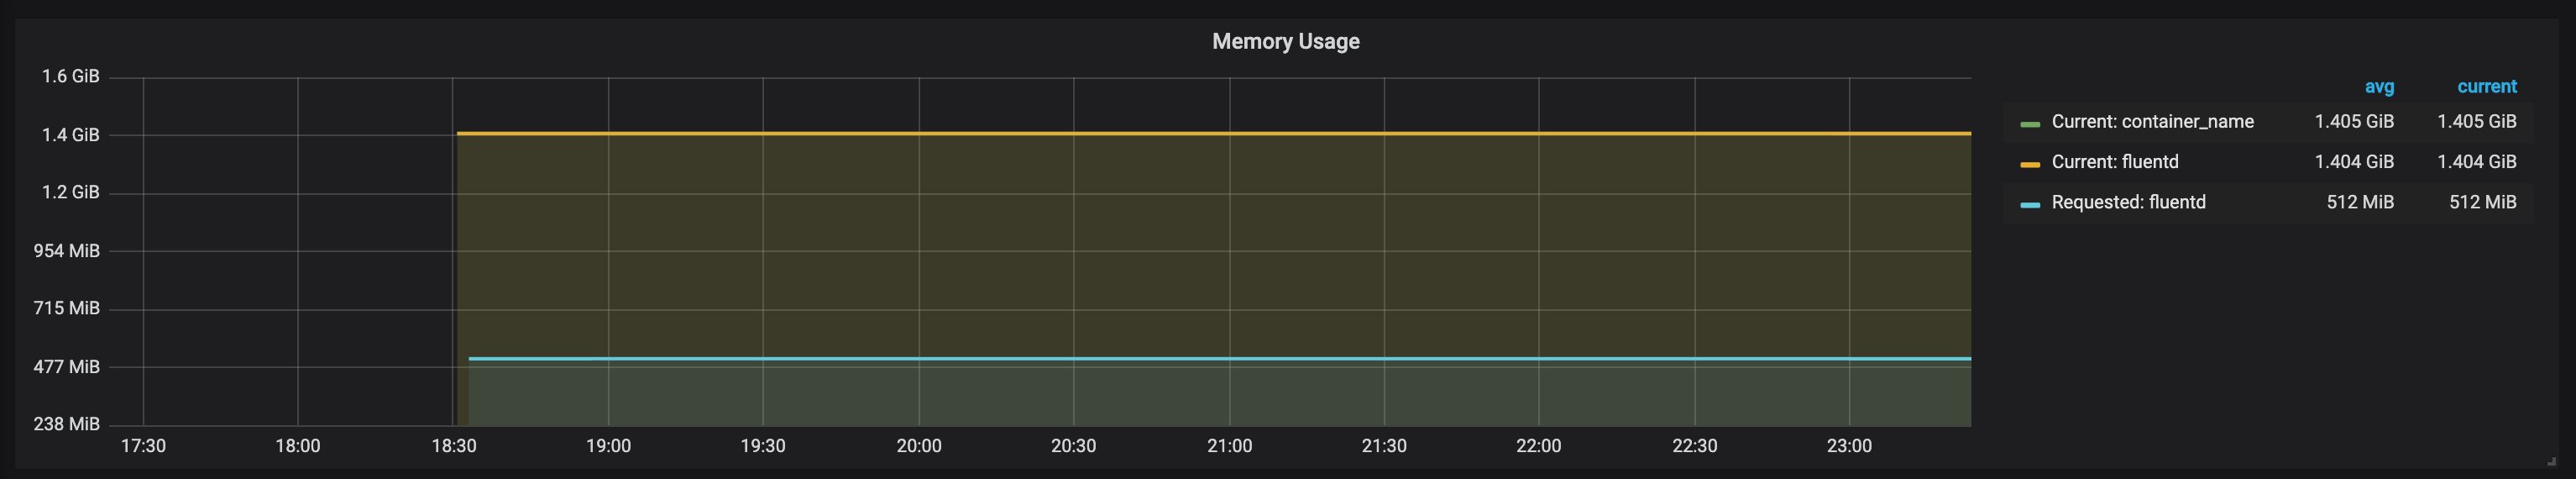
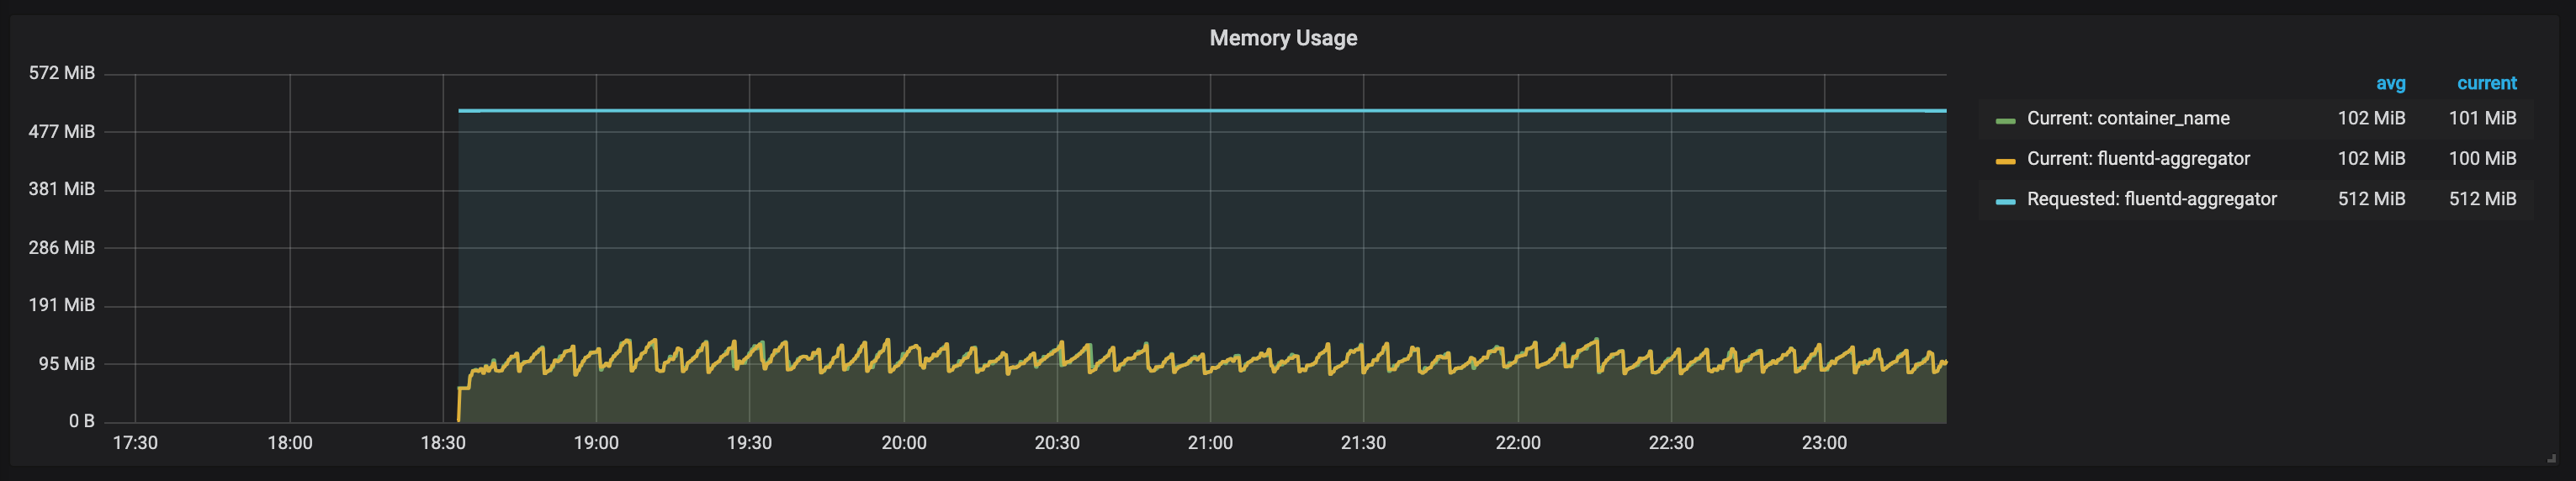
After I change the setting, fluentd aggregator no longer complains about the insertion errors and drops the oldest chunks.
As you can see the following pictures show the memory usage drops dramatically so that it proves that fluentd works perfectly.
References
1 | Logging directly from microservice makes log storages overloaded |
- https://docs.fluentd.org/v1.0/articles/buffer-plugin-overview
- https://github.com/uken/fluent-plugin-elasticsearch
- https://gist.github.com/sonots/c54882f73e3e747f4b20
- https://github.com/fluent/fluentd/blob/3566901ab4a00e0168b4a6078153dde85601fc53/lib/fluent/plugin/buffer.rb
- https://abicky.net/2017/10/23/110103 Very detailed explanation how buffer works